
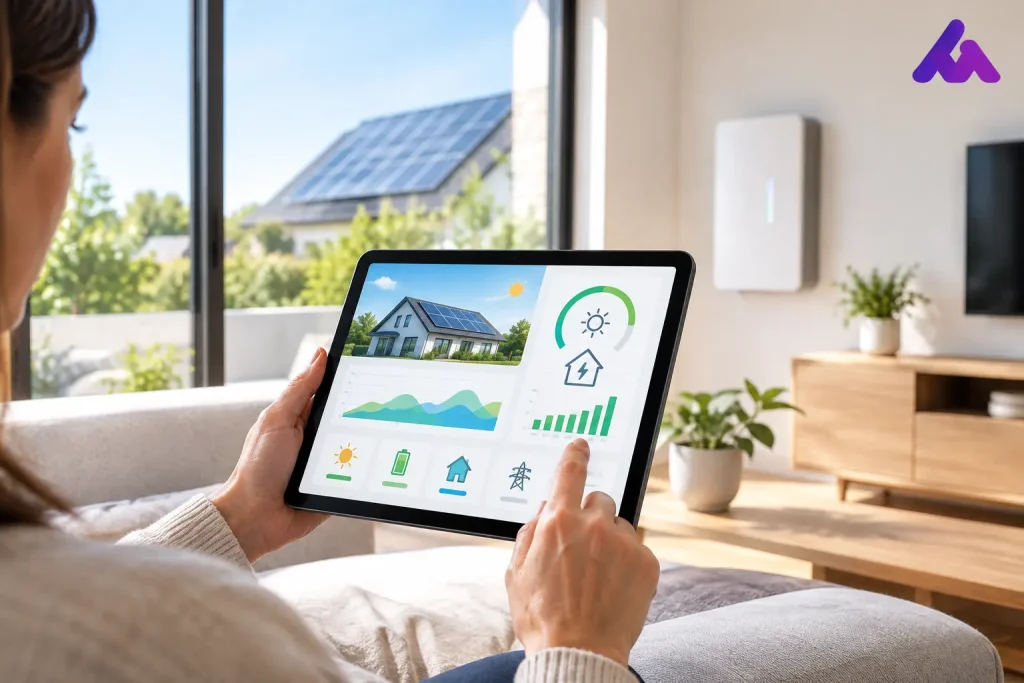
Best Solar Data Dashboards for Smarter Homes
Key takeaways
- The best solar data dashboards turn generation figures into clear decisions about when to use, store, or shift electricity.
- For landed homes, real-time consumption monitoring matters more than attractive charts alone.
- A useful dashboard should show solar production, household load, grid import and export, and battery status in one view.
- Data accuracy, device compatibility, alert settings, and long-term support should guide the selection process.
A solar system can produce excellent numbers on paper while a household still buys more grid electricity than expected. The gap is usually timing: panels generate most strongly around midday, while air conditioning, cooking, and EV charging may happen later. The best solar data dashboards make that gap visible. More importantly, they help homeowners act on it.
For urban landed homes with panels on a roof, car porch, or balcony installation, a dashboard is not just a reporting screen. It is the operating view of the home energy system. It should show what the system is producing, where electricity is going, and whether daily habits are supporting or eroding savings.
What a Solar Dashboard Should Actually Show
A basic inverter app typically reports solar generation, often with daily, monthly, and lifetime totals. That is useful, but it only answers one question: how much did the system produce? It does not explain how much of that energy the home used directly, how much was sent away, or why the electricity bill remains higher than expected.
A stronger dashboard combines four live data streams: PV generation, household consumption, grid flow, and battery flow when storage is installed. With these in a single screen, homeowners can see whether a washing machine is running on solar power at noon or on grid electricity after sunset.
The distinction matters because self-consumption is often where practical savings are won or lost. A home that produces 20 kWh in a day but uses most of its energy after dark has a different optimization opportunity from a home with high daytime air-conditioning demand. The dashboard should make that pattern easy to recognize without requiring the homeowner to interpret engineering charts.
For households considering Plug In Solar or a larger rooftop system, this visibility can also shape the right system size. Historical usage data is more reliable than assumptions about how much electricity a family thinks it uses.
The Best Solar Data Dashboards by Use Case
There is no single best dashboard for every home. The right choice depends on whether the priority is simple visibility, detailed load analysis, battery control, or broader home automation.
Inverter-Level Dashboards for Core Solar Performance
An inverter-level dashboard is the starting point for most solar owners. It tracks panel output, inverter status, system alerts, and production trends over time. This option works well for homeowners who primarily want confidence that their system is operating as designed.
Its limitation is that production data alone can be misleading. A bright day may produce a strong generation graph, yet the household may still rely heavily on grid power during peak evening use. Inverter-only reporting is best for equipment health, not complete energy cost control.
Whole-Home Energy Dashboards for Cost Visibility
Whole-home dashboards add consumption meters at the main electrical panel. This gives the homeowner a full energy picture: solar generation compared with real household demand.
For most landed-home owners, this is the most valuable upgrade. It reveals base load, identifies unusually high overnight consumption, and shows whether daytime appliances are using solar power directly. It can also expose avoidable patterns, such as a pool pump, water heater, or cooling system operating at the least economical time.
The quality of the installation matters as much as the app. If current transformers are incorrectly positioned or circuits are not configured properly, grid import and export figures can be unreliable. A clean dashboard built on inaccurate data is not a decision tool.
Battery and Home Energy Management Dashboards
Homes with battery storage need another layer of intelligence. The dashboard should show state of charge, charging source, discharge behavior, reserve levels, and the amount of stored energy used to support the home.
This is especially useful where evening electricity demand is high. Instead of simply showing that a battery is full, the system should help owners understand whether stored energy is being held back unnecessarily, discharged too early, or used during the periods that deliver the strongest value.
A Tuya-based Home Energy Management System can extend this approach by connecting compatible smart devices and automations. For example, selected loads can be scheduled to run when solar production is high. The objective is not to turn every appliance into a smart appliance. It is to control the few loads that meaningfully affect household energy use.
Features That Separate Useful Dashboards From Attractive Apps
The best dashboards are designed for decisions, not just display. Real-time flow visualization is valuable because it shows direction: solar to home, solar to battery, grid to home, or battery to home. However, real-time data without historical context has limited value. Look for daily, weekly, monthly, and seasonal views that make trends visible.
Alerting is another practical feature. A homeowner should receive a clear notification when production falls unexpectedly, communication is lost, or equipment behavior requires attention. Alerts should be selective. Constant notifications train users to ignore the app, while well-configured alerts support faster issue detection.
Device-level monitoring can be useful, but it is not always necessary. Tracking every light and plug can create data overload. Monitoring larger controllable loads, such as air conditioning, EV charging, water heating, and pumps, normally produces more actionable insight.
Finally, dashboards should present financial information carefully. Estimated savings are useful when they are based on actual metered energy flows and realistic assumptions. A single headline savings figure without the underlying usage pattern offers less value than a transparent view of solar generation, direct consumption, storage use, and grid purchases.
How to Choose a Dashboard for Your Home
Start with the question the dashboard must answer. If the goal is confirming that the solar system is healthy, inverter monitoring may be sufficient. If the goal is reducing electricity costs, whole-home monitoring is usually essential. If the household has storage or plans to add it, choose a platform that can incorporate battery data and control logic rather than treating the battery as a separate device.
Compatibility should be checked before installation. Not every monitoring platform communicates equally well with every inverter, battery, meter, or smart-home device. A fragmented setup can leave owners switching between multiple apps to understand one energy system. A unified view is more useful, particularly when energy use changes through the day.
Also consider who will review the data. A homeowner needs a clear summary and practical insights. An engineering team needs deeper diagnostic information to identify performance issues. The strongest setup serves both audiences: it stays simple for daily use while retaining accurate data for professional analysis and ongoing optimization.
Amsolar approaches monitoring as part of the system design, not as an optional screen added at the end. When solar generation, usage monitoring, battery behavior, and financial performance are measured together, the home has a clearer path to lower operating costs.
The right dashboard should leave you with fewer guesses each month. When you can see when your home produces, consumes, stores, and imports electricity, the next energy decision becomes far easier to make.
